
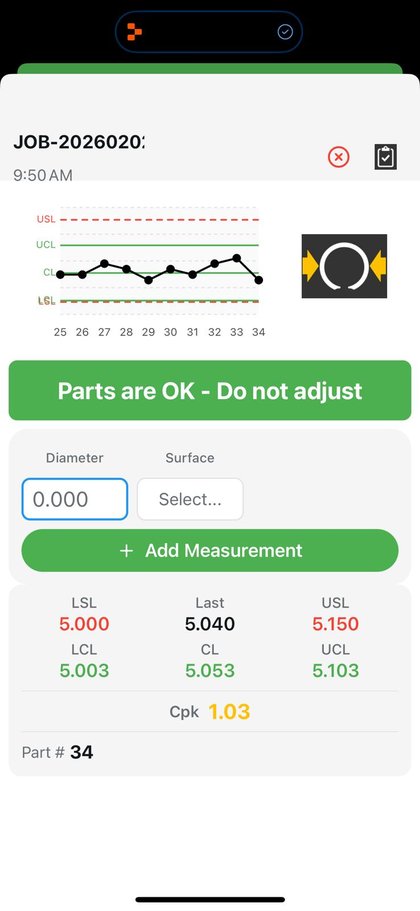
Each measurement goes on the control chart the moment the operator enters it
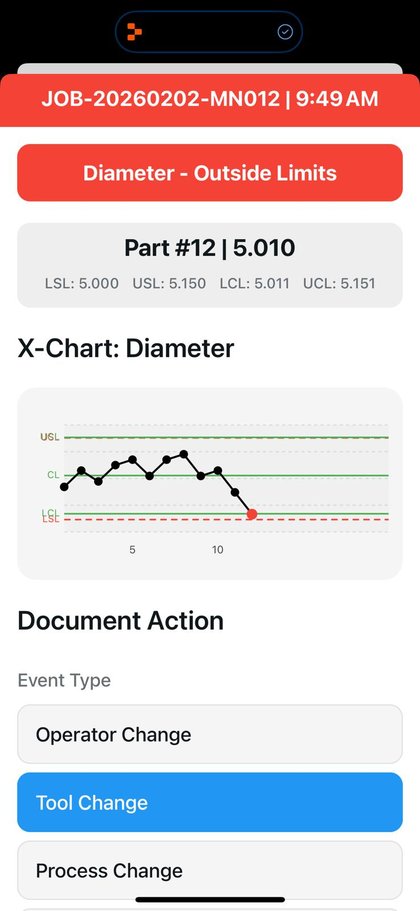
SPC LIVE MACHINE puts the chart, the limits and the alert on the operator's screen, so that a process shift is seen during the run. When an alert fires, the operator records the action taken while the chart is still in front of them.
Two apps for the shop floor and the Quality department
Get real-time visibility, standardize work, and capture quality data where it happens.
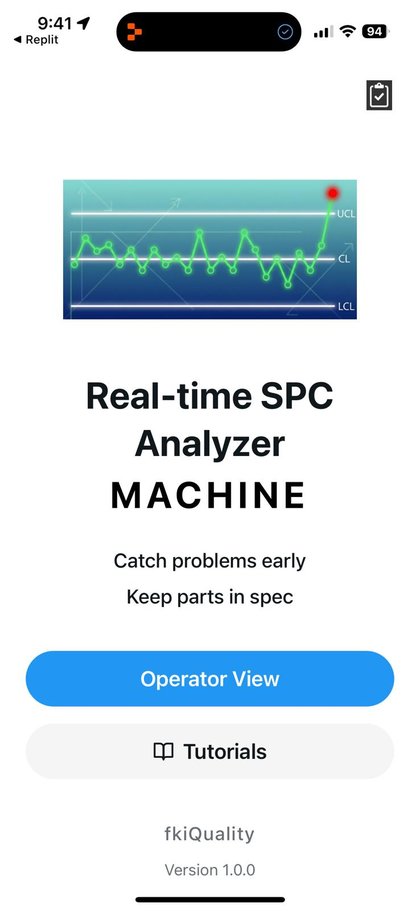
SPC LIVE MACHINE
Real-time SPC on the shop floor—no paper, no delay
- Handles numeric and categorical data
- Live X-mR control charts
- Auto-calculated Cpk & Ppk
- Instant alerts on rule violations
- One-click reports
SPC Analyzer - Individual Values and Subgroups
Measurements to control charts instantly
- Standard X-mR and X̄-R charts for process stability
- Auto-detects outliers and missing data
- Export to Excel or PNG
- Secure sharing with password & expiration
- Batch summary reports included
From the operator's screen to the supervisor's
Instant SPC visibility while you’re making parts
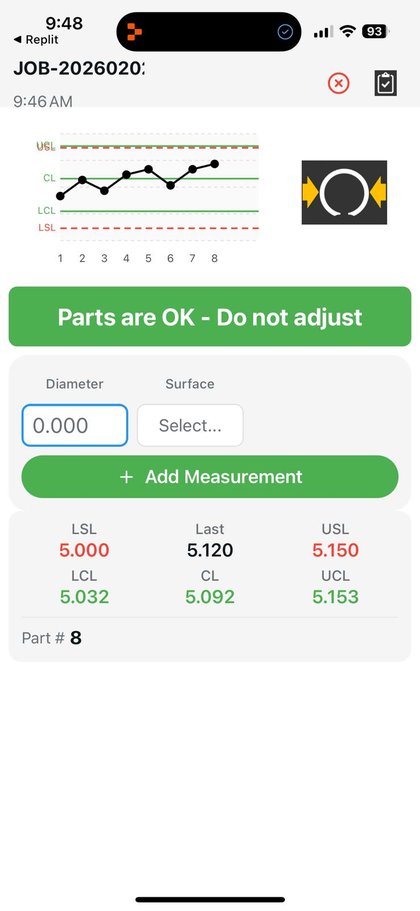
Manually enter numeric measurements (e.g., dimensions) or categorical checks (e.g., pass/fail) during production runs, and see real-time status as you go. The Operator Screen is designed as a single-screen workspace (no scrolling) with a clear status banner so the operator can stay focused.
Automatic control limits + rule-based alerts
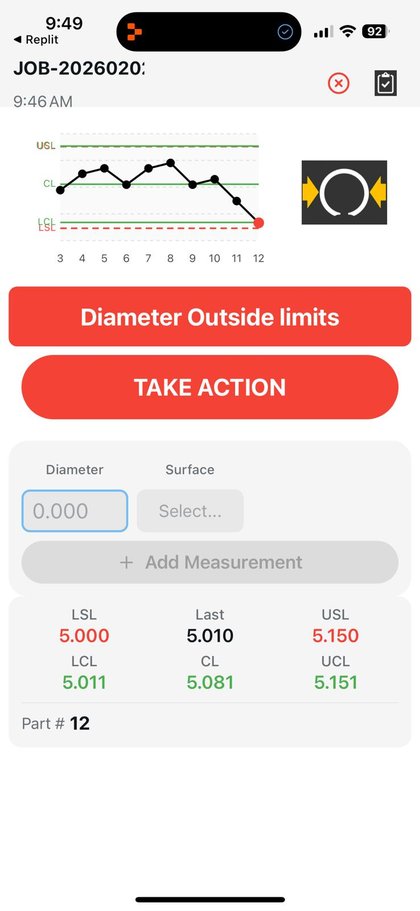
The app automatically calculates control limits using the moving range method and detects key SPC rule violations (e.g., values outside limits, runs like 8 points on one side, sudden changes). Alerts are color-coded for clarity (blue waiting, green OK, amber warning, red critical) so issues stand out immediately.
Built-in actions, traceability, and supervisor-ready reporting
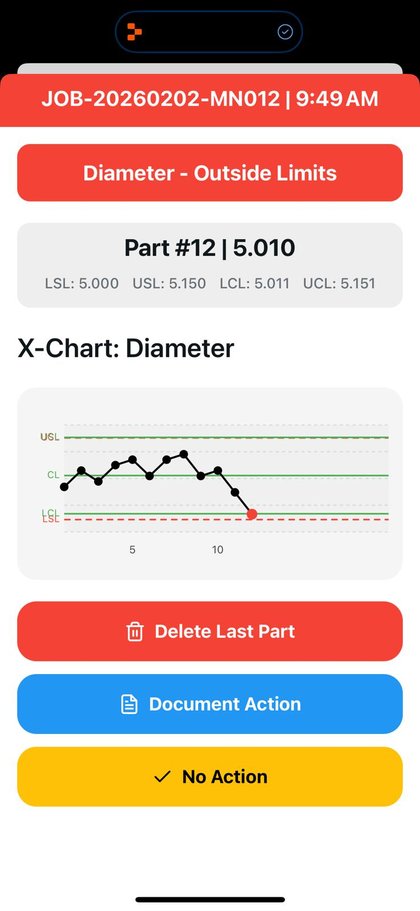
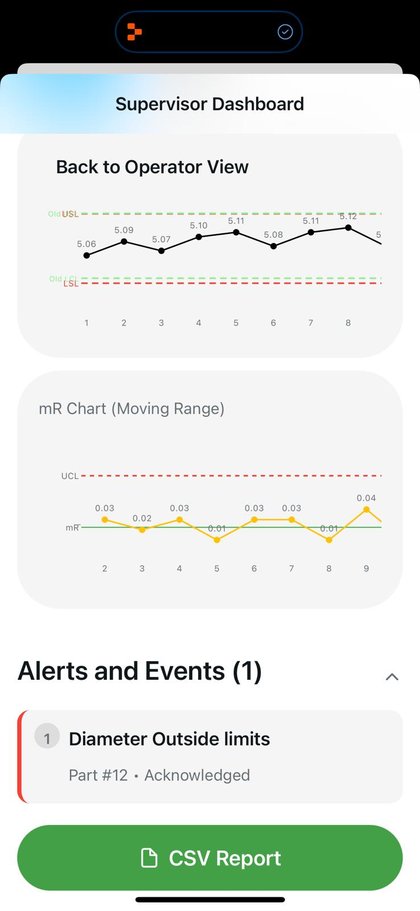
When an alert fires, the operator must acknowledge it and document the action taken (e.g., tool change, process change, material change, operator change, no action, other), with the control chart visible at the moment of decision. Supervisors get a dashboard to review data, view X and mR charts, track events/alerts, and export CSV reports.
Built on proven operational excellence methods.
We apply Lean and Six Sigma thinking, data analytics, and practical problem-solving to improve real operations—not just dashboards. Our approach is grounded in decades of industry and consulting experience.