
Lean Six Sigma Problem Solving Flow
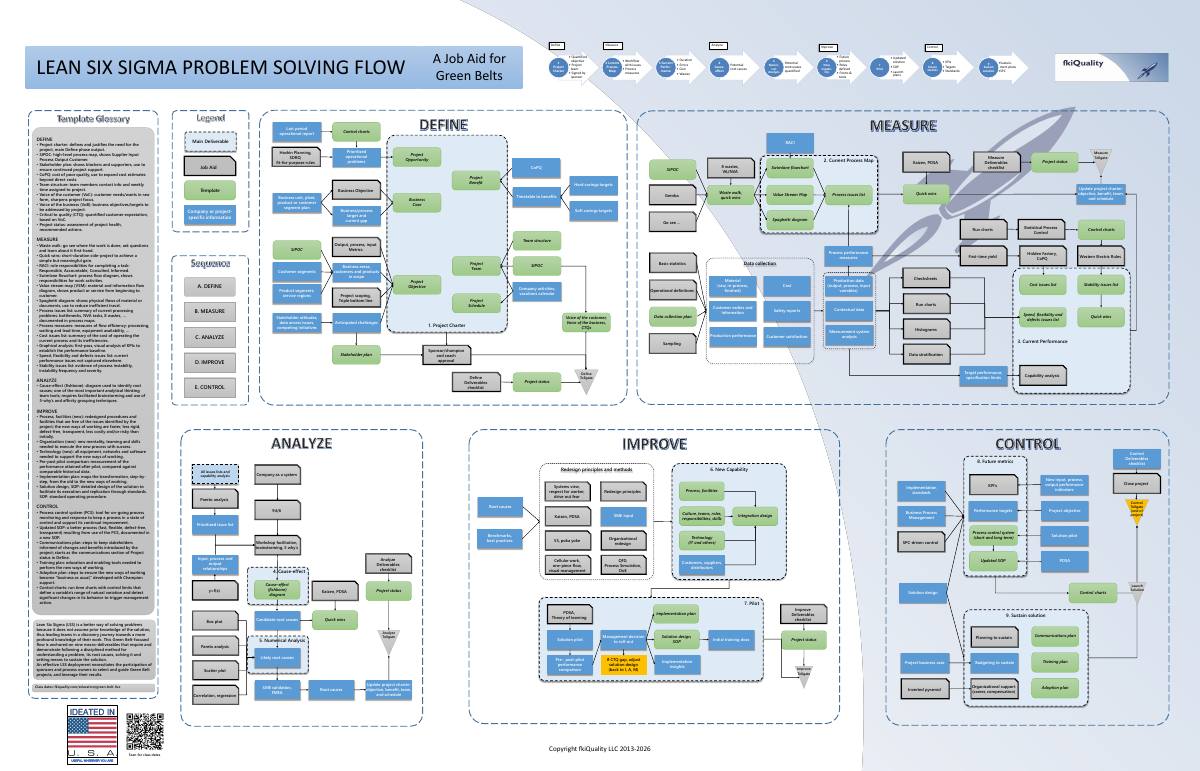
A Green Belt project produces nine deliverables between the day the sponsor signs the charter and the day the team hands the process back to its owner. This poster puts all nine on one page, with the job aids and templates behind each of them and the tollgate where each phase is reviewed. It is drawn at 56 by 36 inches for the printed banner we give our Green Belt graduates.
Get the poster by email
The nine deliverables
- 1
Project charter. The quantified objective, the project team and the sponsor's signature, which together justify the project and close the Define phase.
- 2
Current process map. The workflow as it runs today, drawn after a walk through the place where the work is done, with its issues marked and its process measures attached.
- 3
Current performance. Duration, errors, cost and wastes, measured with a data collection plan so that the baseline rests on readings the team took on purpose.
- 4
Cause-effect. The potential root causes, gathered in a facilitated workshop with the fishbone diagram and the 5 whys.
- 5
Numerical analysis. The potential root causes quantified with Pareto analysis, box plots, scatter plots and regression, then validated by the people who run the process.
- 6
New capability. The future process, with roles defined and the forms and tools people will use to run it.
- 7
Pilot. The solution tried at small scale, compared against its own baseline, and written into an SOP (standard operating procedure) with a launch plan.
- 8
Future metrics. The KPIs, targets and standards by which the process owner judges whether the new process holds.
- 9
Sustain solution. The sustainment plans, with SPC (statistical process control) charts kept running after the team disbands.
The third deliverable includes a capability analysis, and the free Cpk calculator runs one from pasted readings.